A review of the most recent INRIX Trip Trends shows a modest quarterly uptick in vehicle kilometres travelled (VKT) of 0.6 per cent compared to the same period last year. The review is provided by Clarify Group Inc.
For the auto care sector, it is encouraging to see the uplift in vehicle mobility metrics like VKT throughout 2022, albeit not back to pre-COVID levels. Structural changes in working practices, as well as persistent forecasts of economic slowdown remain barriers to full recovery. Assuming some form of working from home (WFH) will be permanent, at least over the near-term, the more significant driver of mobility recovery in 2023 may be macroeconomic conditions.
On the one hand, if Canadians are fearful of recession, we can expect to see continued flatlining of key mobility metrics like VKT through the balance of the year.
On the other hand, given that several macroeconomic indicators like employment, immigration, and gross domestic product (GDP) remain stubbornly positive, continued VKT growth remains possible.
On balance, Clarify Group is of the view that we will see continued recovery in VKT and related mobility metrics through the balance of 2023, albeit at low single, not double-digit levels. Canada is a large country with relatively few people. With no pandemic fear or restrictions, Canadians will continue to drive.
Vehicle travel trends metrics and overview
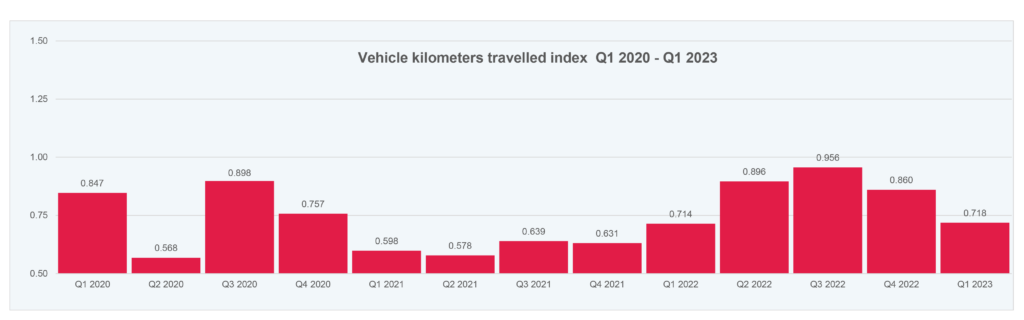
INRIX Trip Trends measures Canadian vehicle mobility across four key measures: vehicle kilometres travelled, trip duration, trip count, and average travel distance. INRIX reports on these measures via an index methodology with the baseline set in early 2020. This baseline provides us with a ‘typical’ period before COVID-19 so we can observe if, when, and where mobility trends among passenger vehicles are returning to pre-pandemic levels.
VKT quarterly figures highlight Canada’s strong seasonality, with kilometres travelled increasing in the spring and summer months and declining in the colder periods. Quarterly year-on-year (YOY) comparisons show that Canadians drove further in 2022, with most quarters seeing double-digit increases compared to the same period in 2021: Q2 2022 index score up 55 per cent YOY, Q3 2022 up 50 per cent YOY, and VKT up 36 per cent in the last quarter of the year. However, this trend line stalled in the first quarter (Q1) of 2023, with only marginal VKT growth of 0.6 per cent on a YOY basis.
Changes in VKT are important for the auto care sector (also known as the aftermarket) as they highlight trends in mobility across the country and have implications for light vehicle service, parts, and maintenance demand.
We are able to see how the national trend plays out across Canada for most regions. On balance, most of Canada experienced VKT declines led by the Prairies down nearly 5 per cent (harsh winter likely a factor), Quebec down 2 per cent, and Ontario down just over 1 per cent. Bucking the VKT decline is British Columbia, up almost 3 per cent.
Vehicle kilometres travelled (% change YOY)
| Period | Canada | British Columbia | Prairies | Ontario | Quebec |
| Q1 2021 | -29.4% | -23.7% | -18.9% | -35.4% | -19.4% |
| Q2 2021 | 1.9% | -6.0% | -1.3% | -0.6% | 20.9% |
| Q3 2021 | -28.8% | -36.5% | -27.5% | -28.3% | -22.6% |
| Q4 2021 | -16.6% | -27.4% | -21.1% | -15.7% | -6.7% |
| Q1 2022 | 19.3% | 12.0% | -0.3% | 23.8% | 20.8% |
| Q2 2022 | 54.9% | 58.9% | 27.0% | 74.9% | 41.4% |
| Q3 2022 | 49.6% | 65.8% | 25.1% | 47.6% | 36.9% |
| Q4 2022 | 36.2% | 45.8% | 20.7% | 32.9% | 30.9% |
| Q1 2023 | 0.6% | 2.9% | -4.8% | -1.2% | -2.0% |
Multiple factors are driving the Q1 2023 slowdown including a weakening economy (impact of higher interest rates, inflation, and energy costs) and changing work practices.
Recent analysis from the Canadian Chamber of Commerce Business Data Lab1 reveals that “… three years after the pandemic, and over a year after most pandemic-related restrictions have been lifted, we’re still seeing a significant reduction in Canada’s workplace mobility”. Specifically, Business Data Lab research shows that 9 per cent fewer Canadian households commuted to work in January 2023 compared to the same pre-pandemic month in 2020. All provinces except Saskatchewan have yet to recover to pre-pandemic mobility levels, with many of Canada’s largest cities hardest hit including the Census Metropolitan Areas of Winnipeg (-27 per cent), Toronto (-22 per cent), Ottawa-Gatineau (-20 per cent) and Quebec (-17 per cent), all reporting larger drops compared to the national average.
There are examples of urban areas that have more than fully recovered mobility levels including Saskatoon, Regina and several smaller cities in Ontario outside the GTA like Barrie, Guelph and Kitchener-Waterloo. Ultimately though, Business Data Lab’s research concludes that hybrid work is here to stay. For the auto care sector, this means full recovery in Canadian VKT compared to pre-pandemic levels is unlikely in the near future.
Trip duration figures show a similar trend to VKT with an anaemic 0.4 per cent increase across Canada in Q1 2023 on a YOY basis.
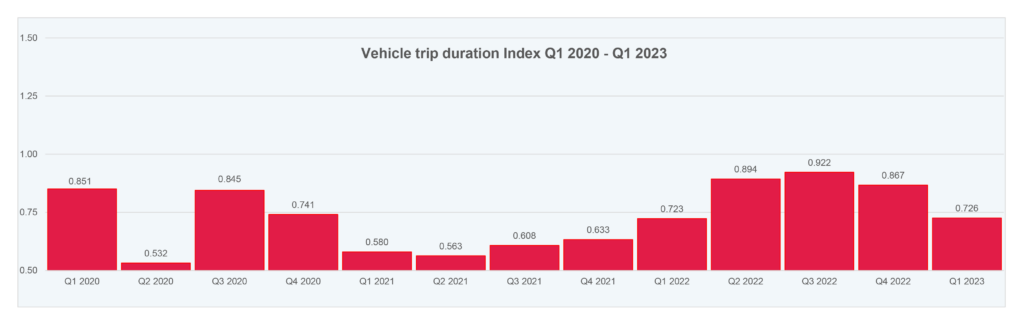
Shorter trip durations compared to other quarters suggests a tendency for drivers to take more local journeys compared to longer drives, especially with work from home.
The number of trips indexed by INRIX in the trip count report indicates an encouraging return to vehicle usage in the last three quarters of 2022, but similar to the other reported metrics, year-on-year growth for Q1 2023 remains marginal (up only 1.1 per cent).
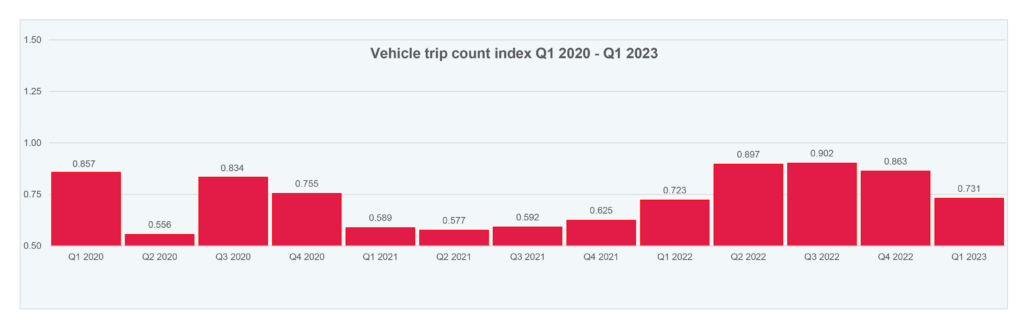
The number of trips taken are influenced by various factors, though, perhaps surprisingly, trip counts are not strongly correlated with gas prices. Despite the average unleaded price increasing by 69 per cent in 2022 compared to 20202, and record levels reached in June 2022 of $2.07 per litre, drivers continued to increase their overall VKT, trip duration and trip counts compared to the previous year. As INRIX notes across global markets, including Canada, [text wrapping break]“… fuel prices had a small effect on the amount people travelled but have increased the [financial] burden drivers and freight-movers shoulder”3.
To learn more about the INRIX Trends methodology and to consult the various data points in details, please visit our Vehicle travel trends in Canada tool.
Sources:
1. https://bdl-lde.ca/publications/a-big-change-is-happening-in-canadas-urban-centers-ushering-a-new-era-of-doing-business/
2. www150.statcan.gc.ca; monthly average retail prices for gasoline and fuel oil. 21 March 2023.
3. 2022 INRIX Global Traffic Scorecard, January 2023.
About Clarify Group Inc.
A Canadian research and advisor group combining decades of automotive experience, a gloal perspective, and unique digital tools. At a time when the industry is transforming like never before, we bring clarity to the road ahead. Our industry is experiencing transformative change on a scale and pace we have not seen before—from how we perceive the vehicle itself (mechanical device or software platform), how it is powered, hw it is marketed, sold, serviced and upgraded over time, and how it is financed (or subscribed to). In these uncertain times, it is sometimes hard to tell whether the glass is half-empty or half-full. And that is where Clarify enters the scene, with its ability to help clients understand and respond to the evolving needs.
Learn more at about Clarify Group Inc.
Disclaimer
Clarify Group Inc. (”Clarify Group”) makes no representations or warranties, express or implied, with respect to the content, accuracy, truthfulness or reliability of any information contained here above, whether in full or in part, including any warranty of title, noninfringement of copyright or any other rights of others, merchantability, or fitness or suitability for any purpose. Without limiting the generality of the foregoing, by using this commentary, the user expressly acknowledges that there are no warranties or representations made by Clarify Group regarding the content of this commentary in terms of its accuracy or its completeness. In no event shall Clarify Group be liable for any damages whatsoever resulting from, arising out of or in connection with the use of any information provided in this commentary.